Monitoring Service Health: CPU, Memory, and Storage
Introduction
This feature provides real-time and historical visibility into your landscape's service resource consumption. By tracking CPU, Memory, and Storage, you can proactively manage performance, troubleshoot bottlenecks, and ensure system stability all within the workspace cockpit.
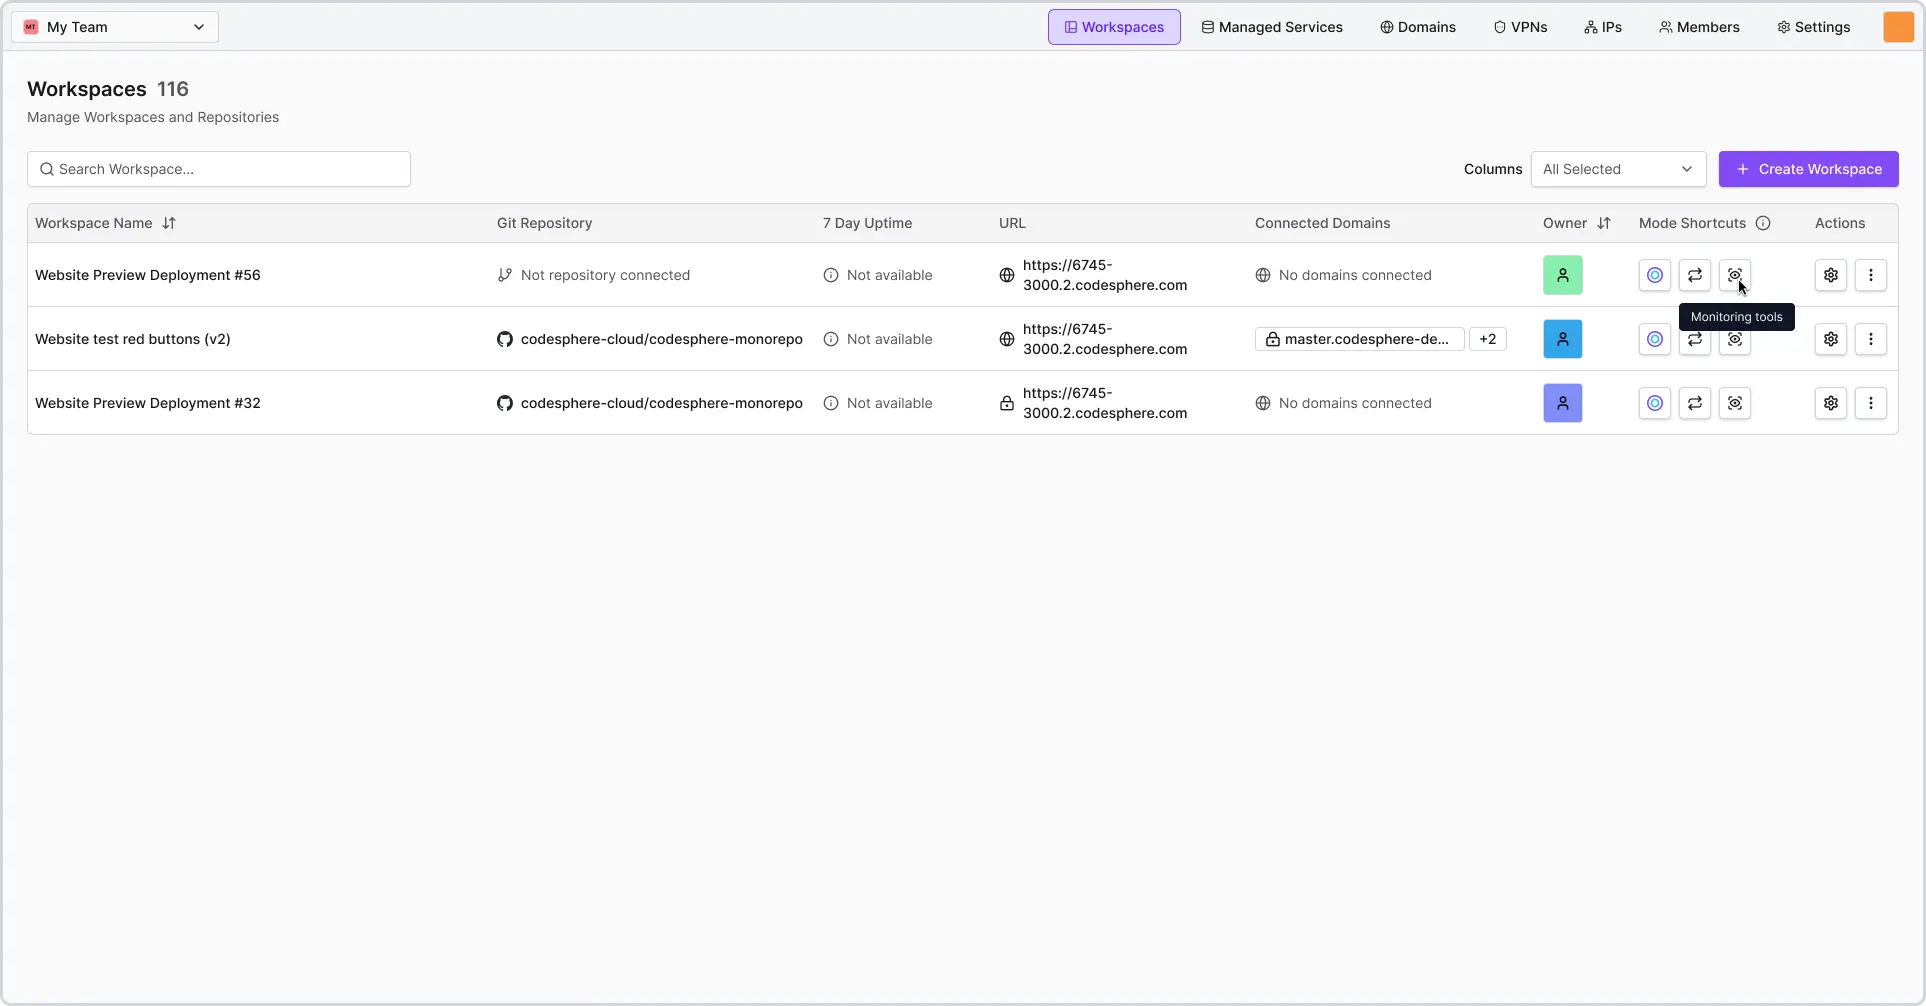
Navigating the Dashboard
To access your metrics, navigate to the Monitoring mode in the workspace.
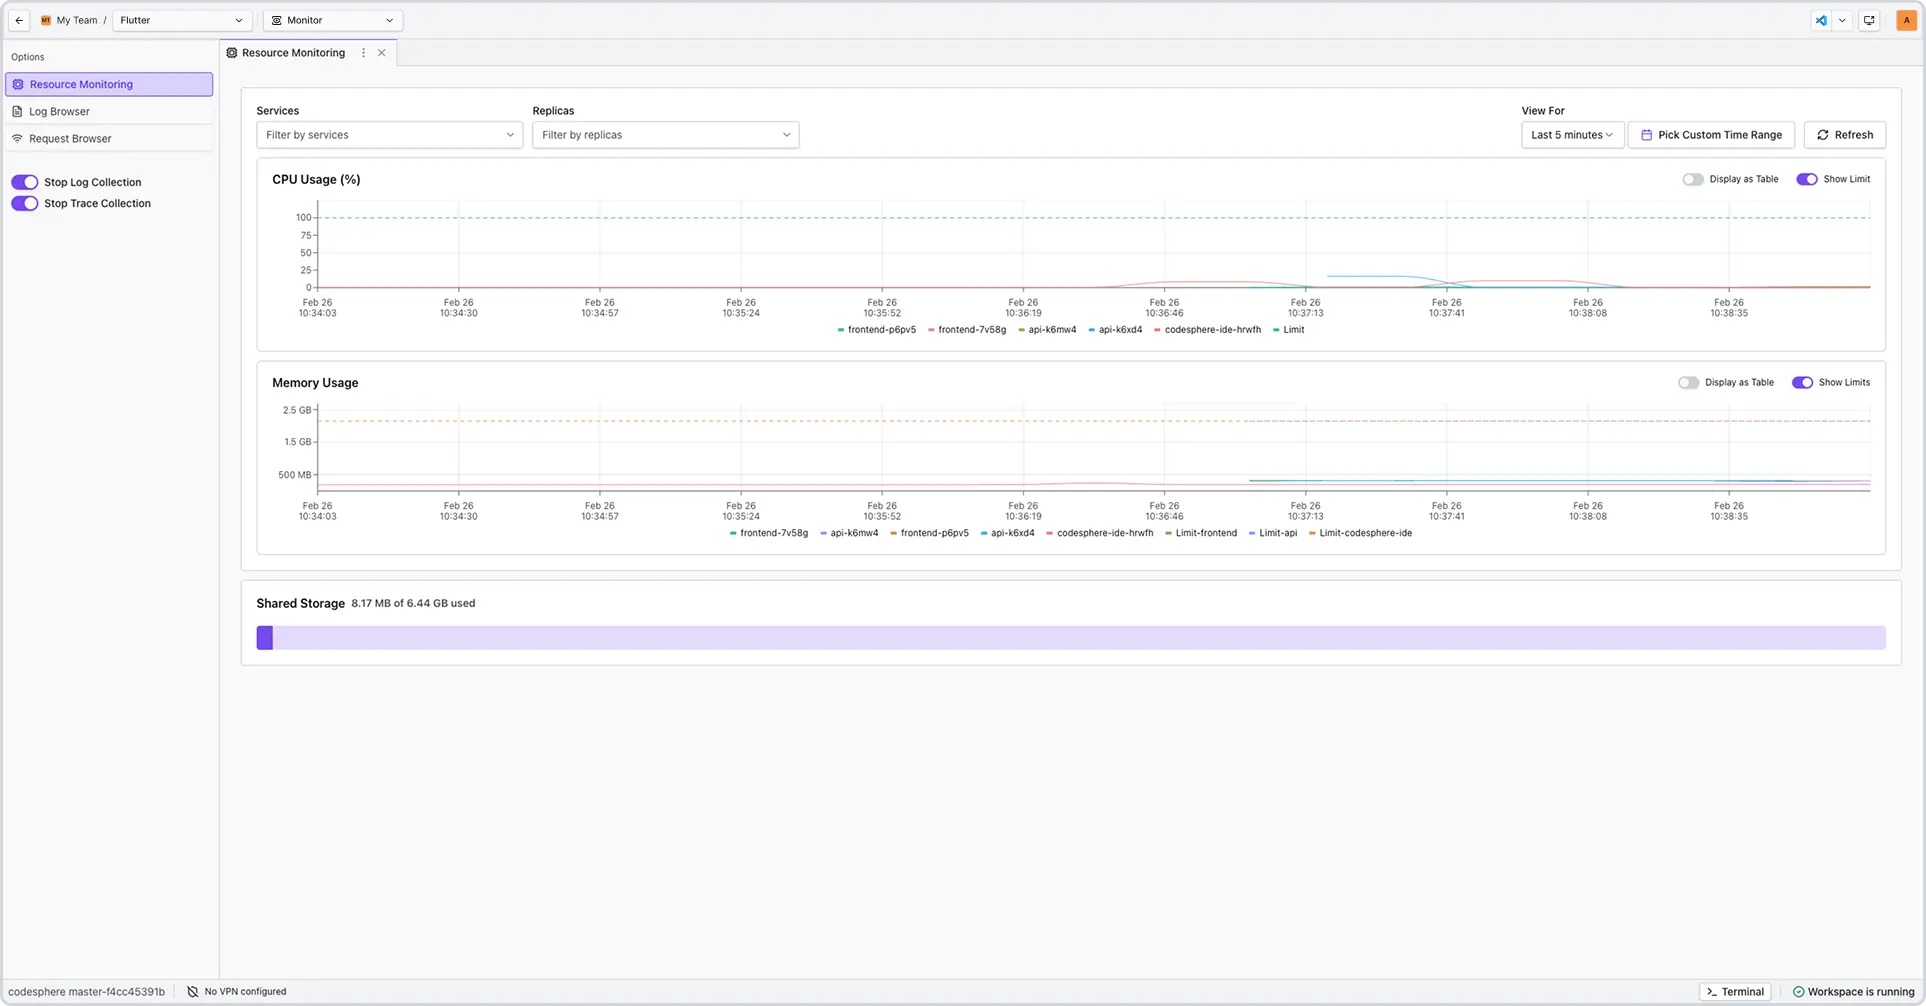
Using Filters
The dashboard allows you to narrow your focus to specific timeframes or data points:
- Time Range: Use the dropdown to select presets (e.g., Last 15 minutes, 24 hours) or define a custom date range.
- Metric Isolation: Filter specific graphs to compare CPU spikes against Memory consumption during a known event.
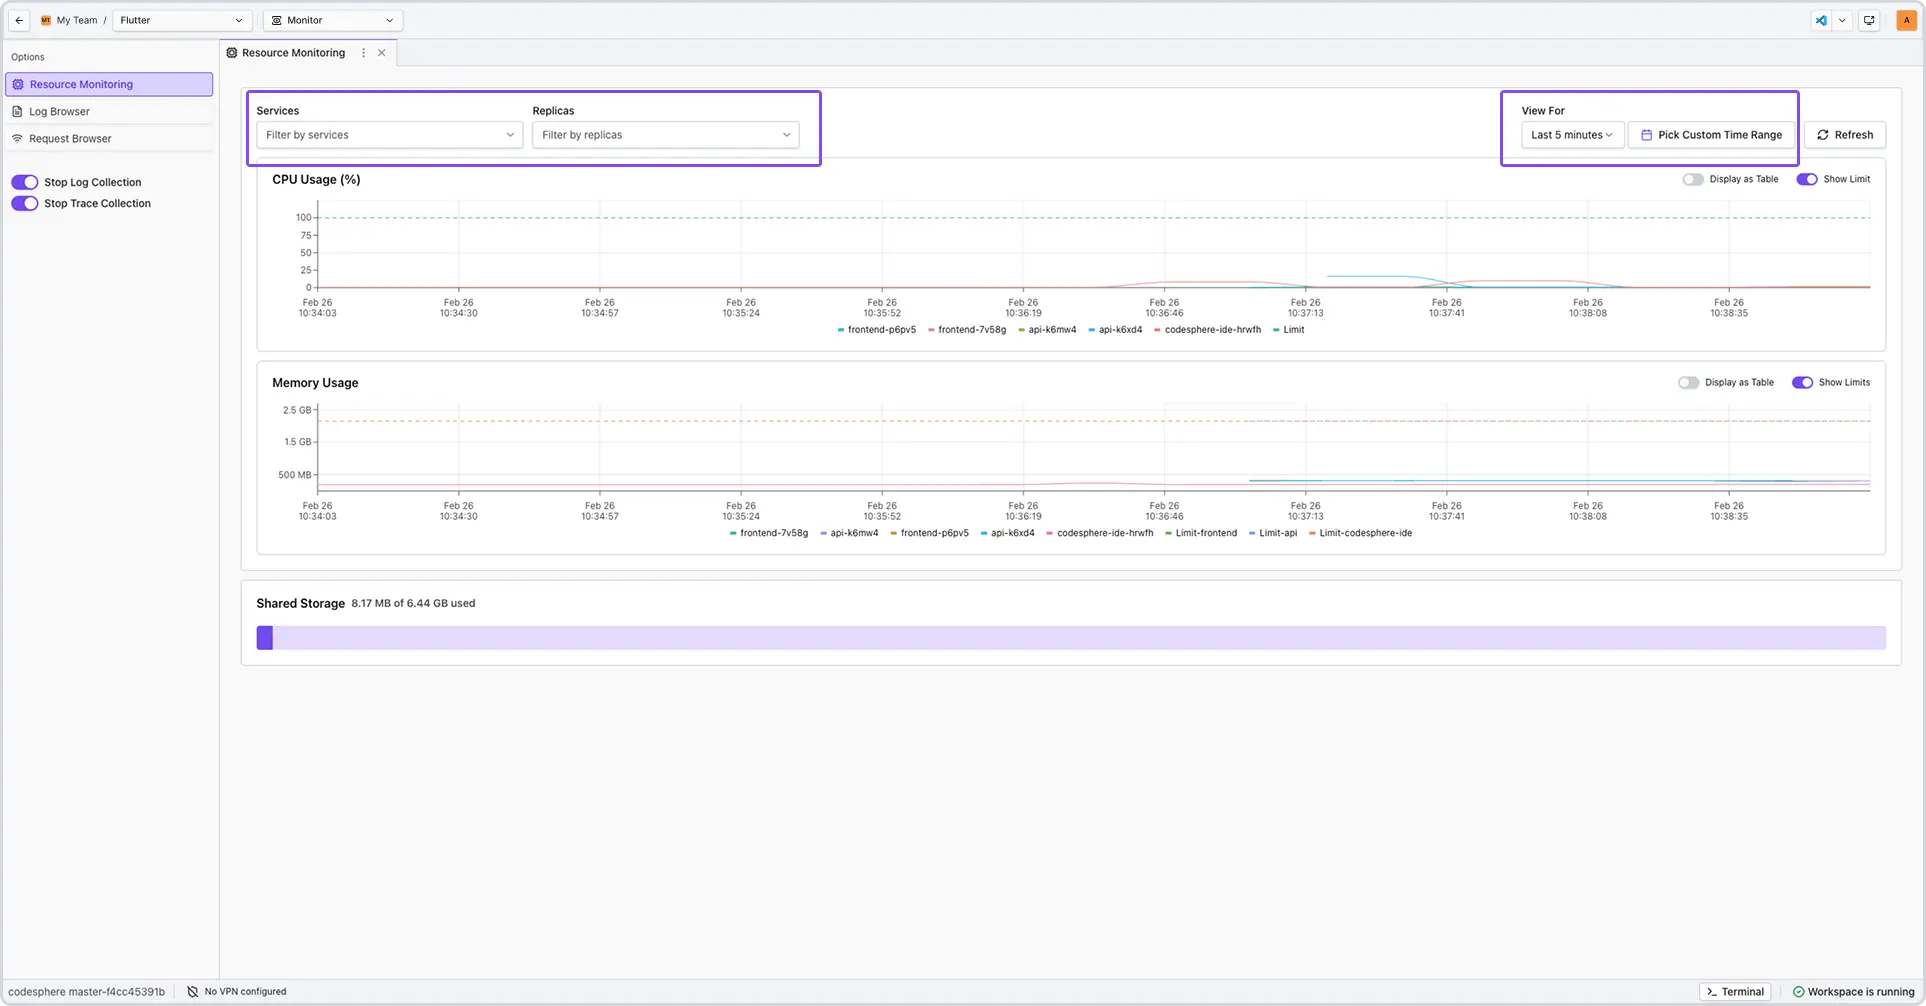
Accessible Table View
For users who prefer raw data or utilize assistive technology, every graph can be toggled into a Table View.
Understanding the Metrics
CPU Usage
Measures the percentage of processing power in use. Sustained peaks above 80% may result in command latency or slowed application performance.
Memory (RAM) Usage
Tracks the active data footprint of your workspace. A consistent "upward climb" in the graph, even during idle periods, often indicates a memory leak in a background process.
Storage Capacity
Displays total disk usage. Monitoring this is critical for data-heavy landscapes; if storage reaches 100%, the system will fail to save files and may cause the workspace to become unresponsive.
Troubleshooting
| Data Pattern | Likely Cause | Recommended Action |
|---|---|---|
| High CPU / High Memory | Resource-intensive task (e.g., compiling code). | Wait for task completion or upgrade instance. |
| Stable CPU / Rising Memory | Software memory leak. | Restart the specific service or application. |
| Low CPU / 100% Storage | Disk volume is full. | Delete temporary files or expand storage volume. |
Frequently Asked Questions
-
How often is the dashboard data refreshed?
The dashboard is designed for static analysis to ensure data consistency while you work. Use a time filter or the Refresh button to pull data. -
How far back can I view data?
We provide a 2 day retention window for resource records. We use a 'First-In, First-Out' logic, meaning that if you hit your storage capacity within those two days, Codesphere will automatically replace the oldest records with the newest ones. -
What happens if I hit my storage limit?
The system will stop writing new data. We recommend monitoring the Storage graph and acting once usage exceeds 85%.