Codesphere Log Browser
The Log Browser is an integrated observability tool designed to simplify debugging workloads in Codesphere. It provides a unified view of the logs your application's services print and your pipeline's historical build logs. By centralizing these streams, the Log Browser helps you move from detecting an issue to identifying the root cause quickly.
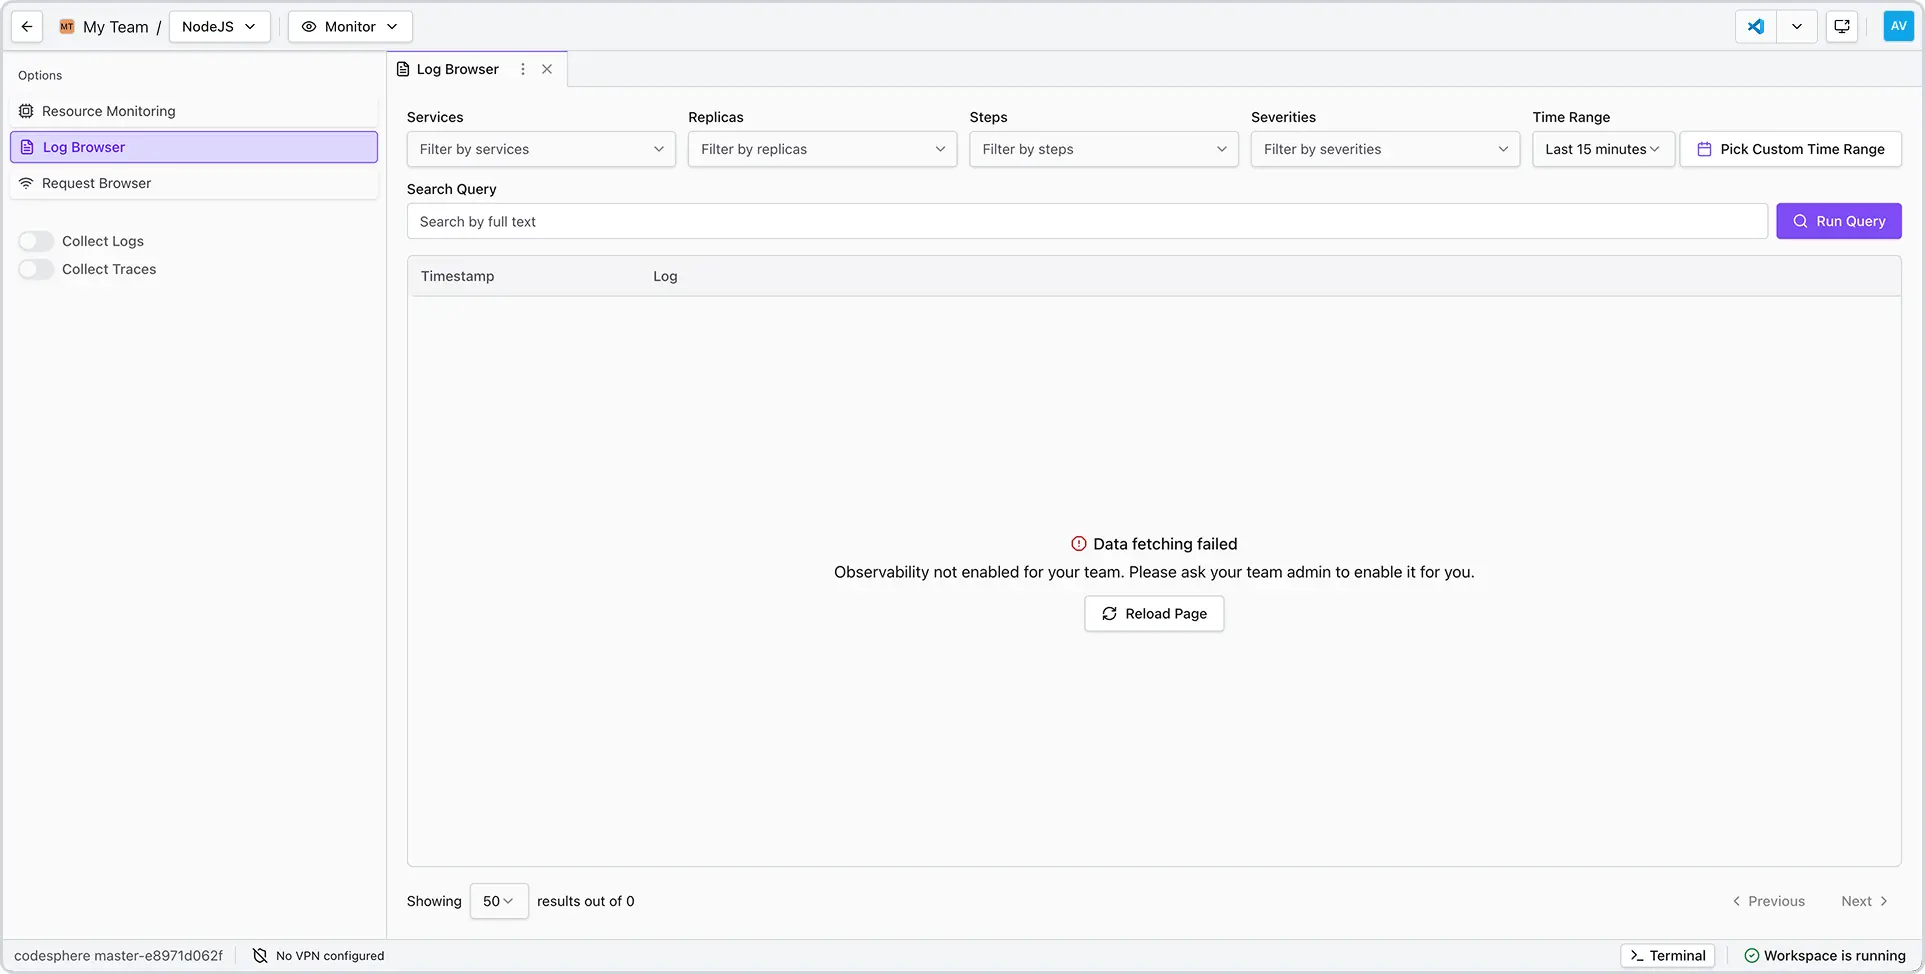
How to Enable the Log Browser
The Log Browser is not enabled by default. To get started, monitoring first needs to be enabled in both the Resources Group (Team) and the individual Landscape. For detailed instructions, please refer to our How to Enable Monitoring article.
Info: Only Resource Group (Team) admins can enable the monitoring platform.
Architectural Overview

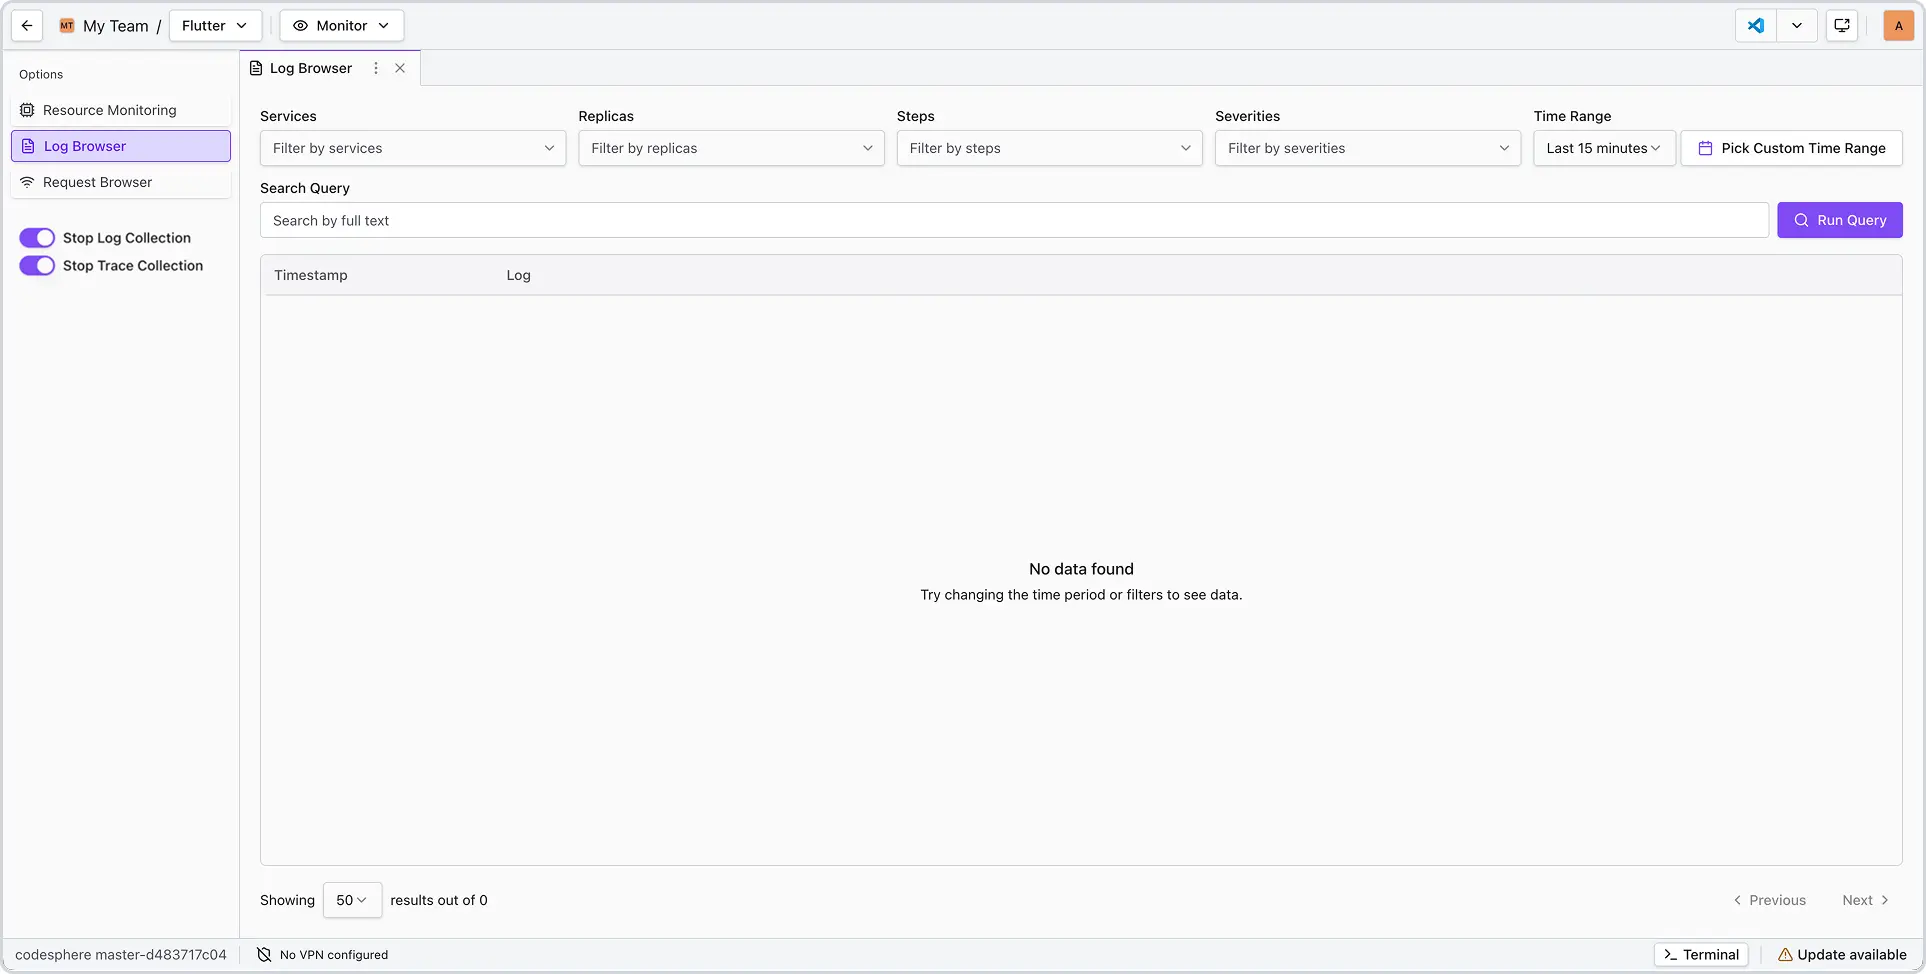
Using the Log Browser
Data Retention and Storage
- Retention Window: Logs are retained for 14 days. After this period, data is automatically purged.
- Storage Limits: Log storage is subject to a space quota. If exceeded, the oldest logs are automatically overwritten.
Warning: Disabling monitoring at the Resource Group (Team) level triggers an immediate, permanent deletion of all historical logs for that group. This action cannot be undone.
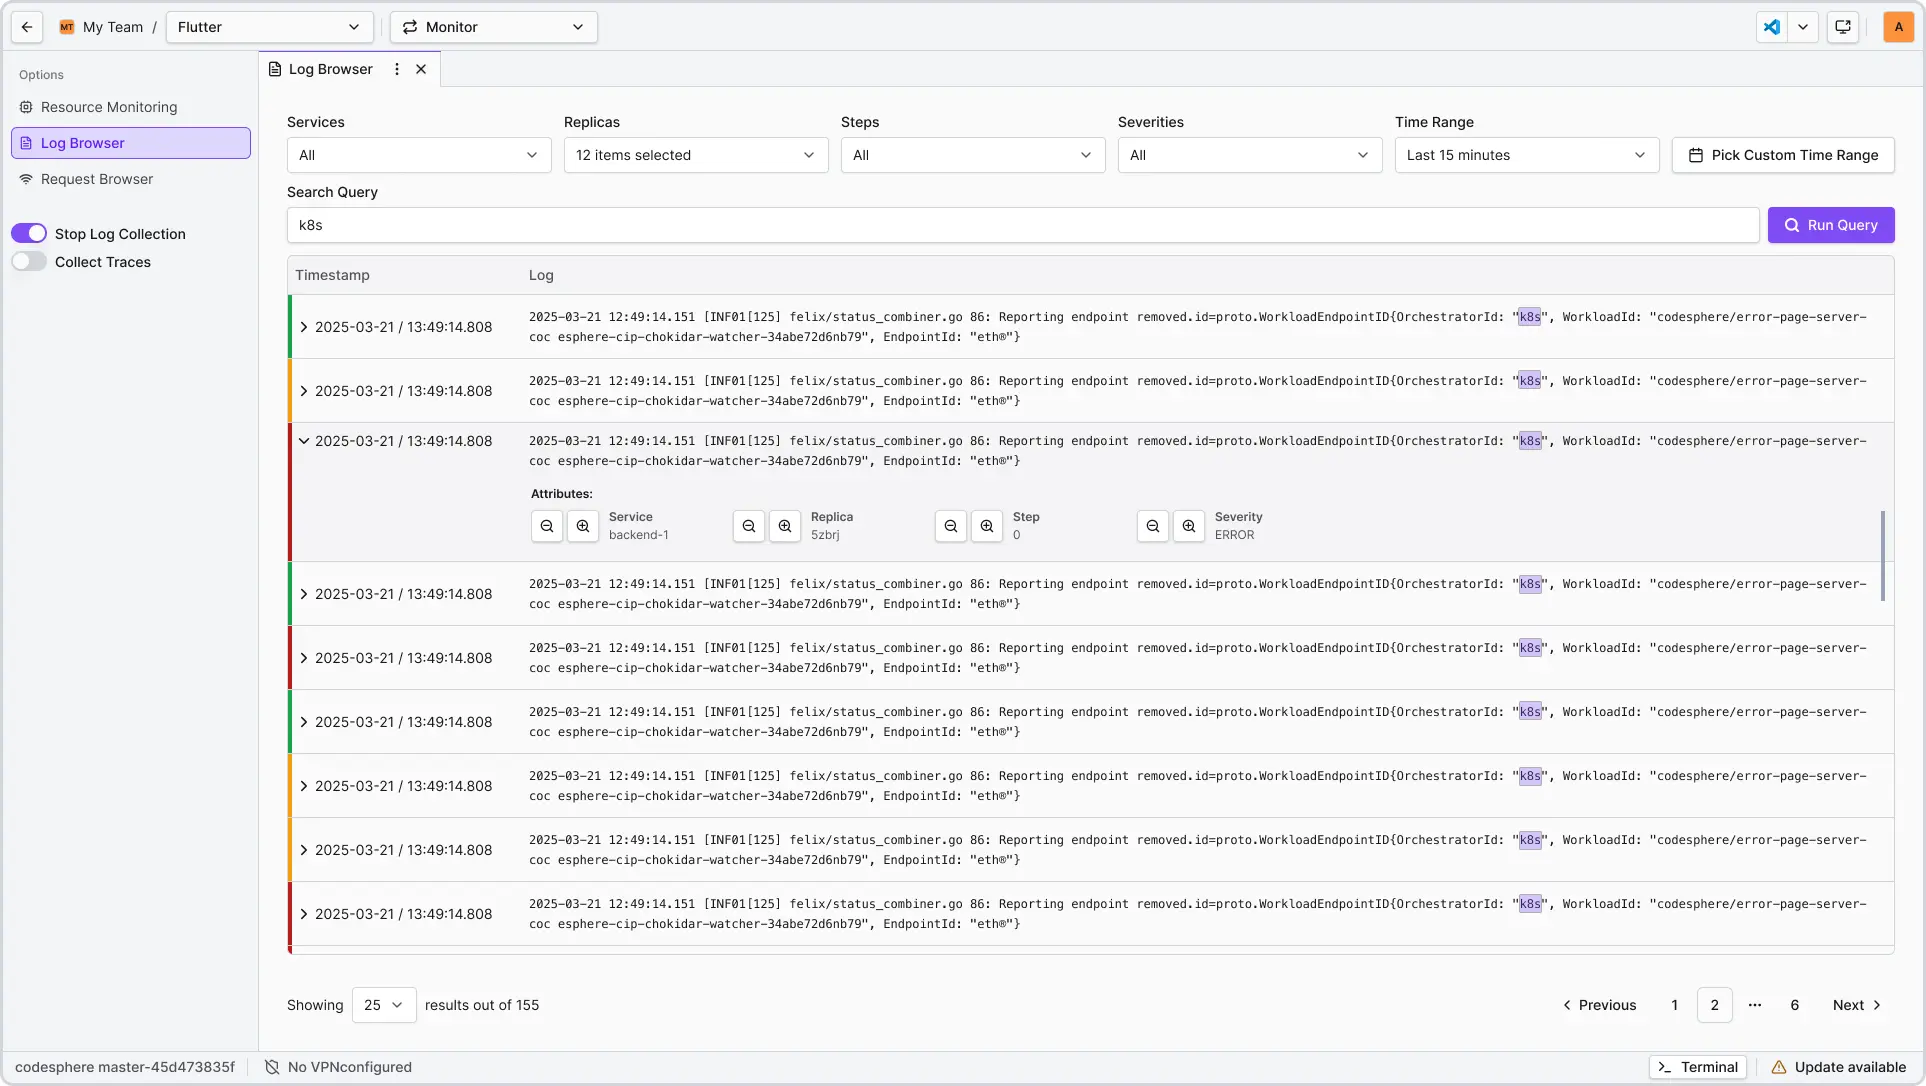
Filtering and Analysis
-
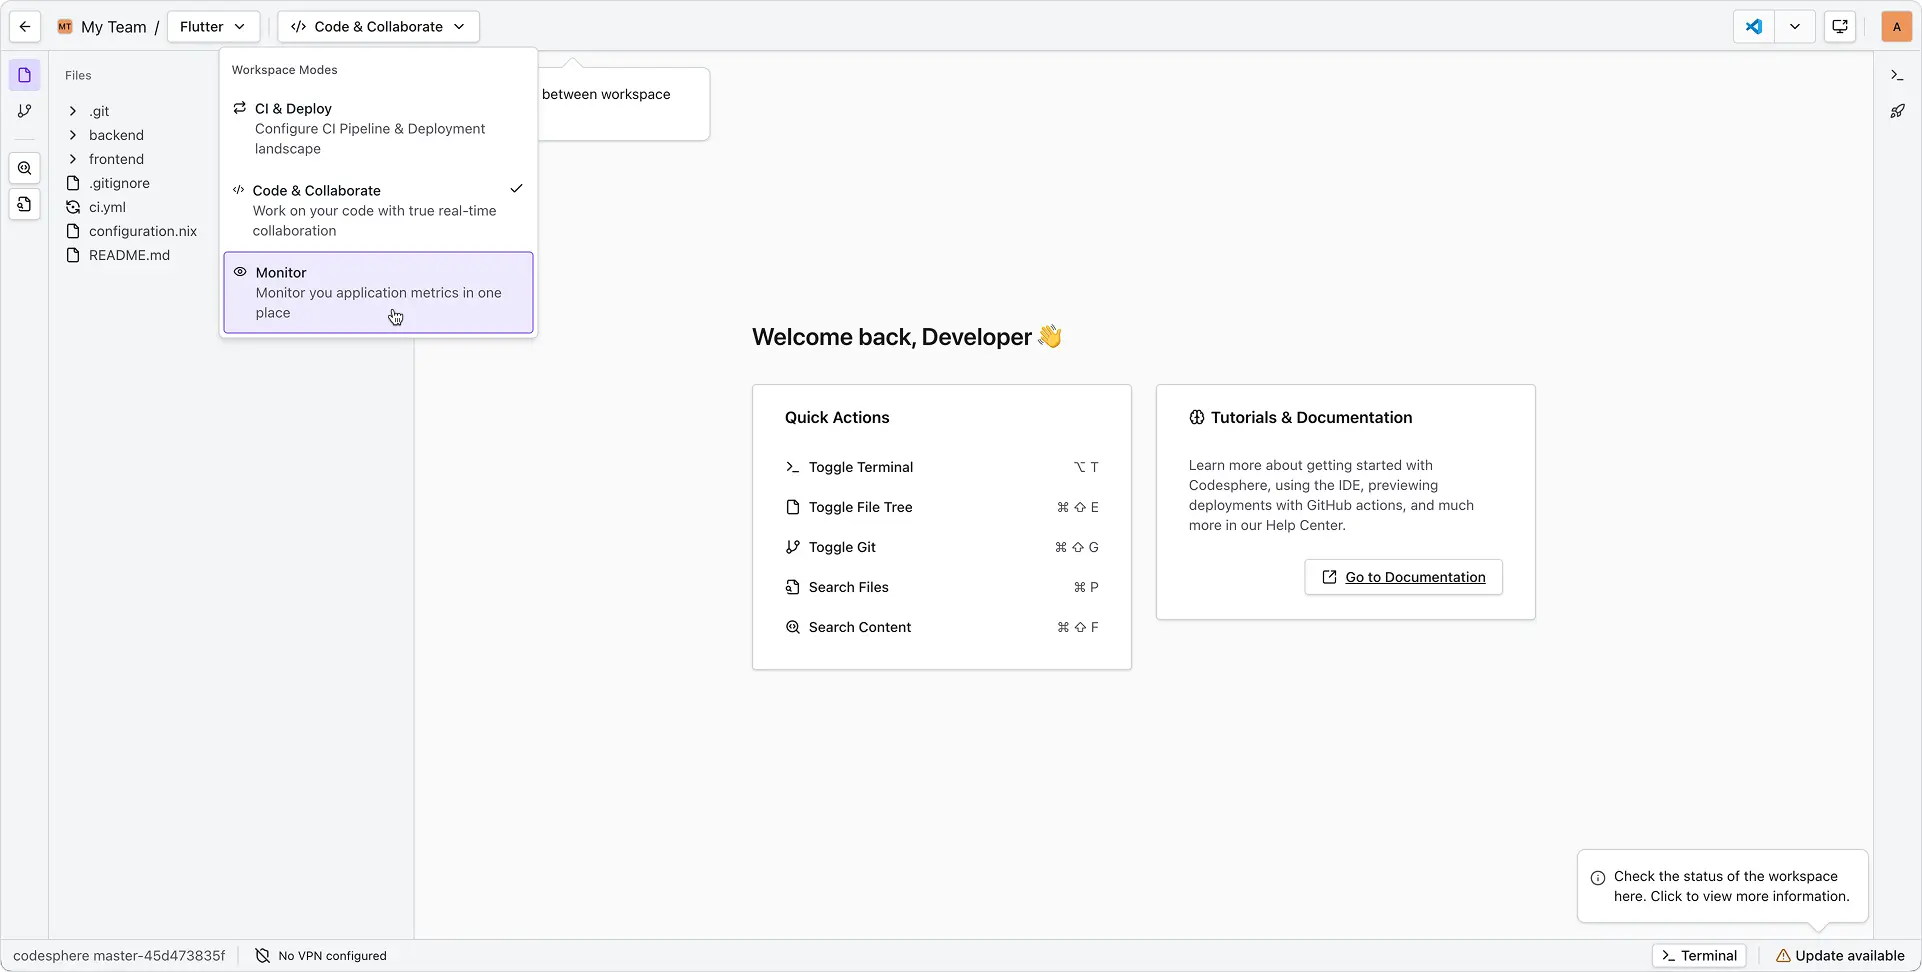
Navigate: Go to the Monitoring workspace mode.
-
Locate: Select the Log Browser tab.
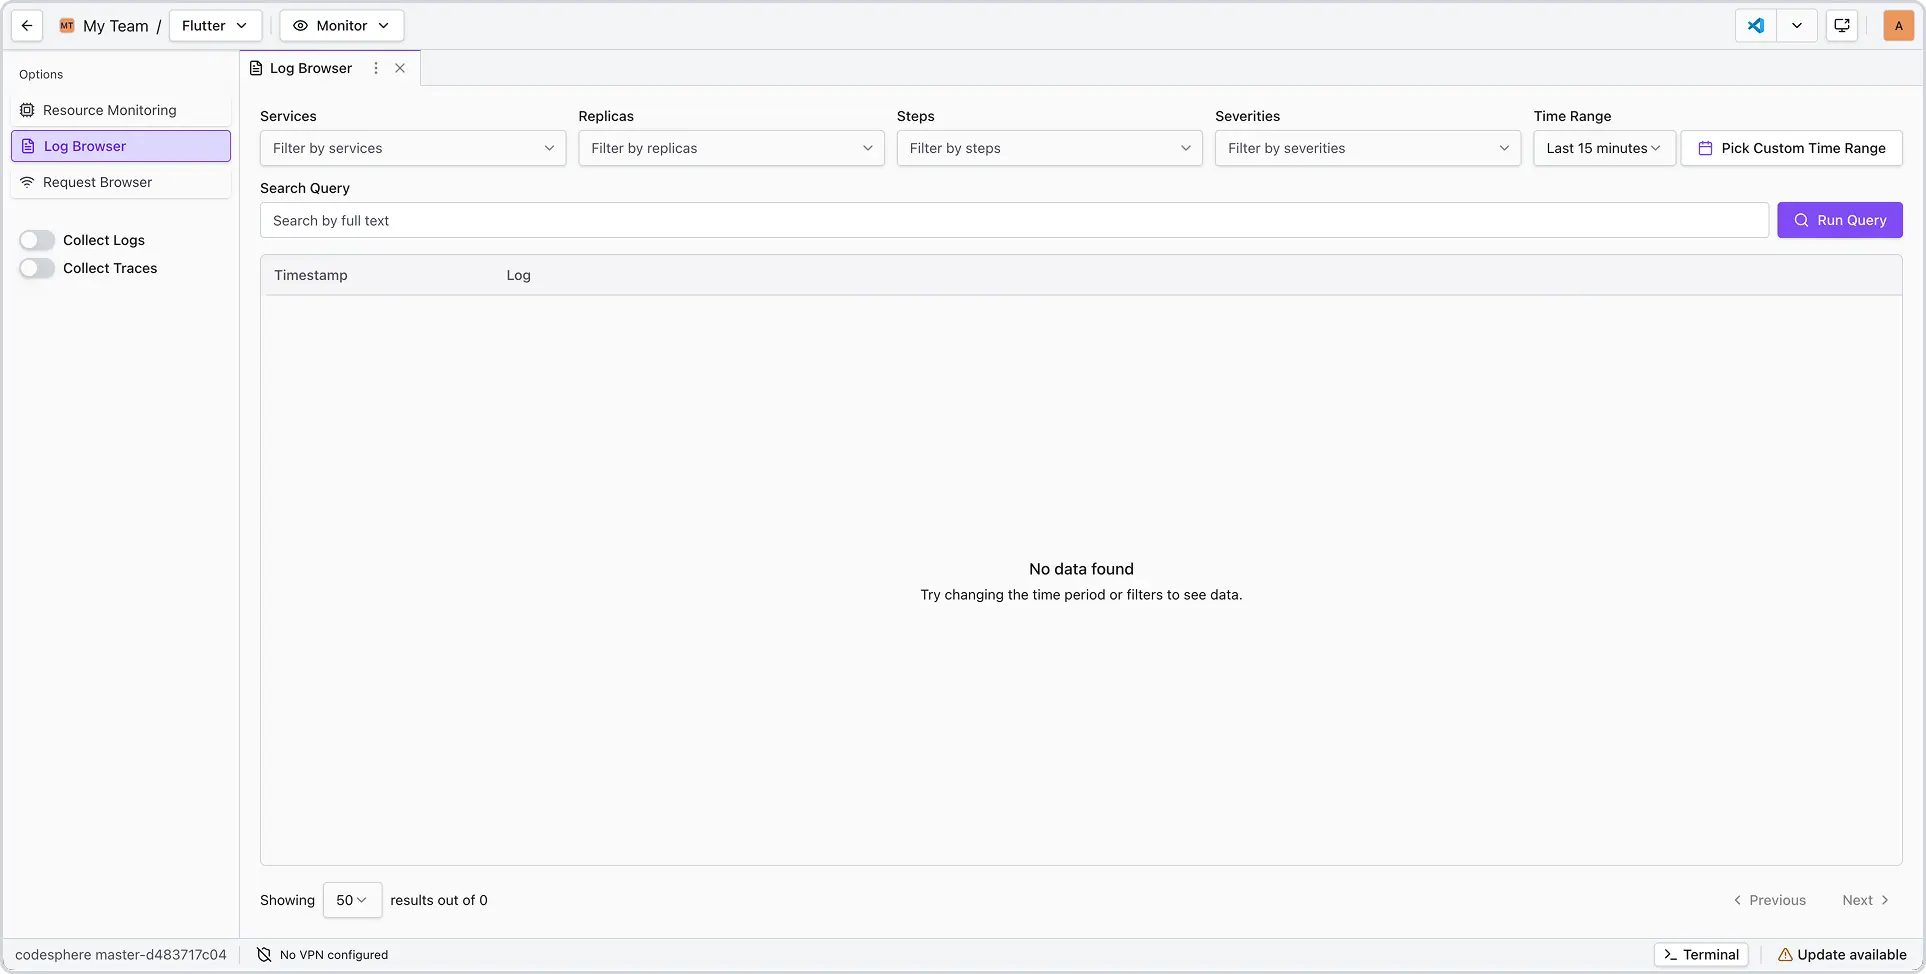
Tip: No data showing? This usually appears when no requests match your criteria. Adjust your filters or select a different time range.
-
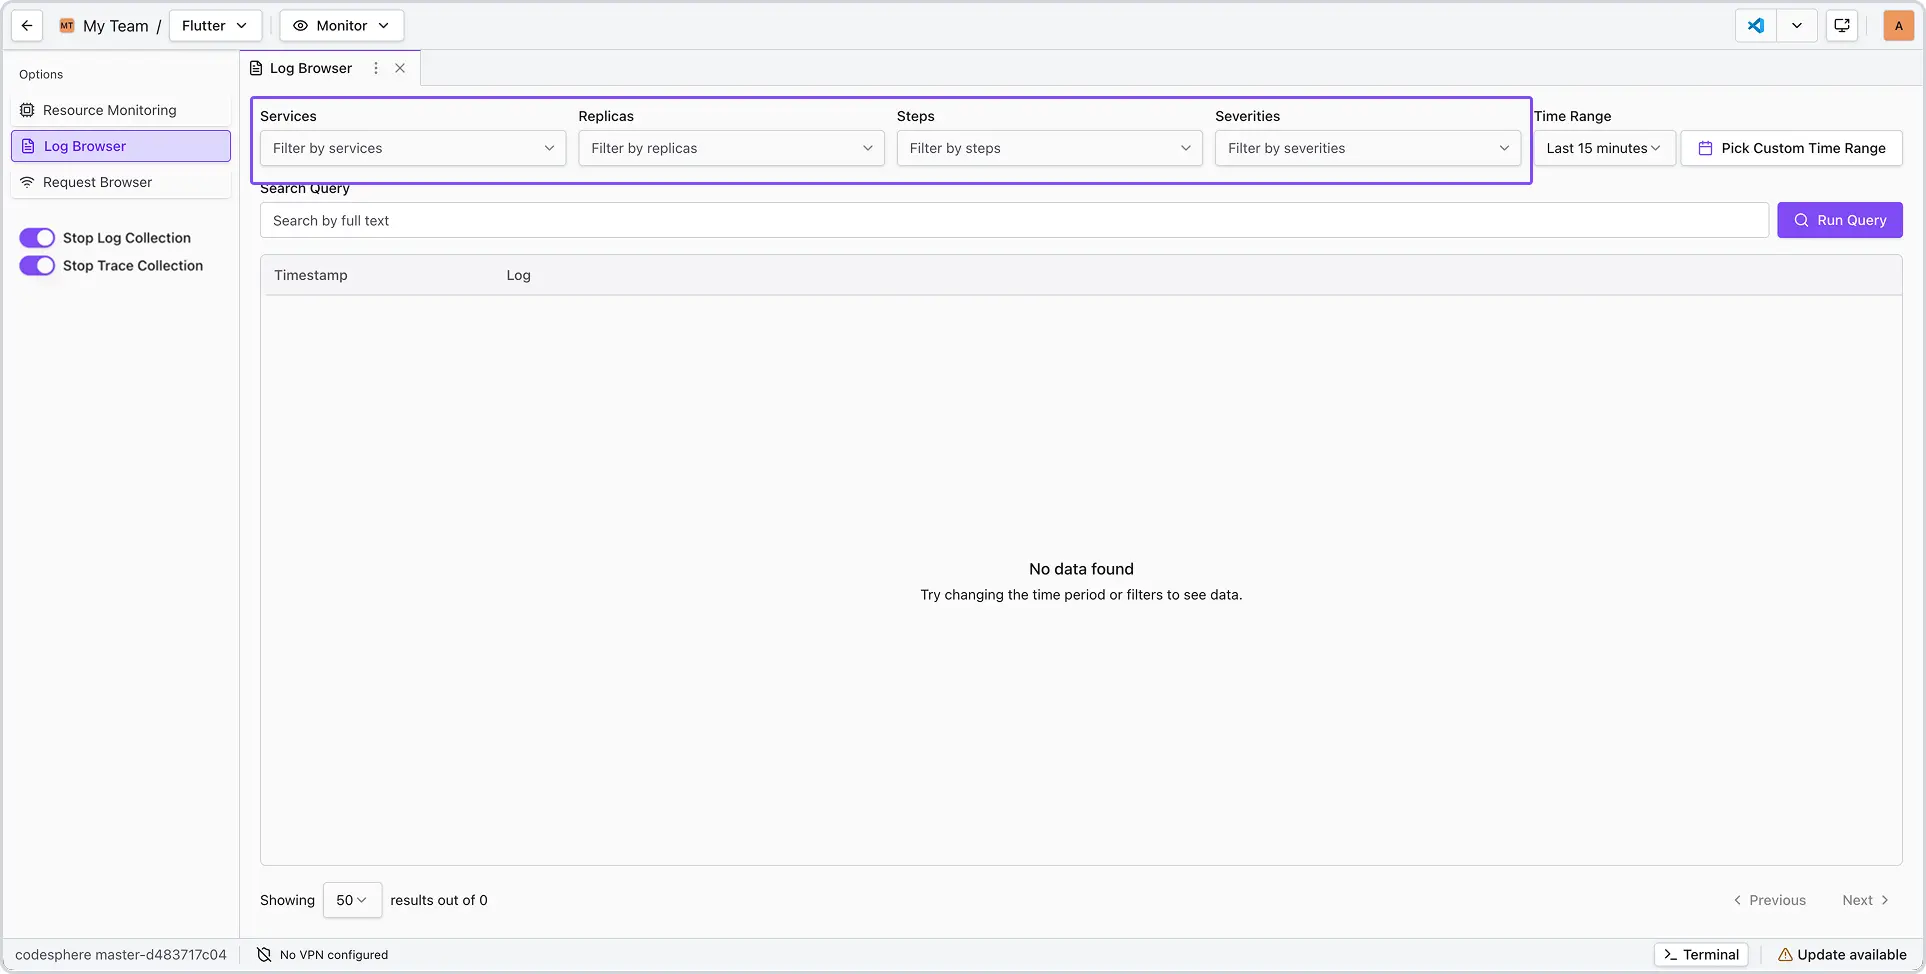
Filter by service name, replica ID, execution step, or severity.
-
Search & Advanced Syntax Use the search bar to locate specific entries using these operators:
| Operator | Syntax | Description |
|---|---|---|
| Wildcards | auth-* | Matches any character sequence (e.g., auth-service, auth-error). |
| Exact Phrases | "Database failed" | Finds that specific phrase in that exact order. |
| Keywords | ERROR | Isolates logs by simple text content. |
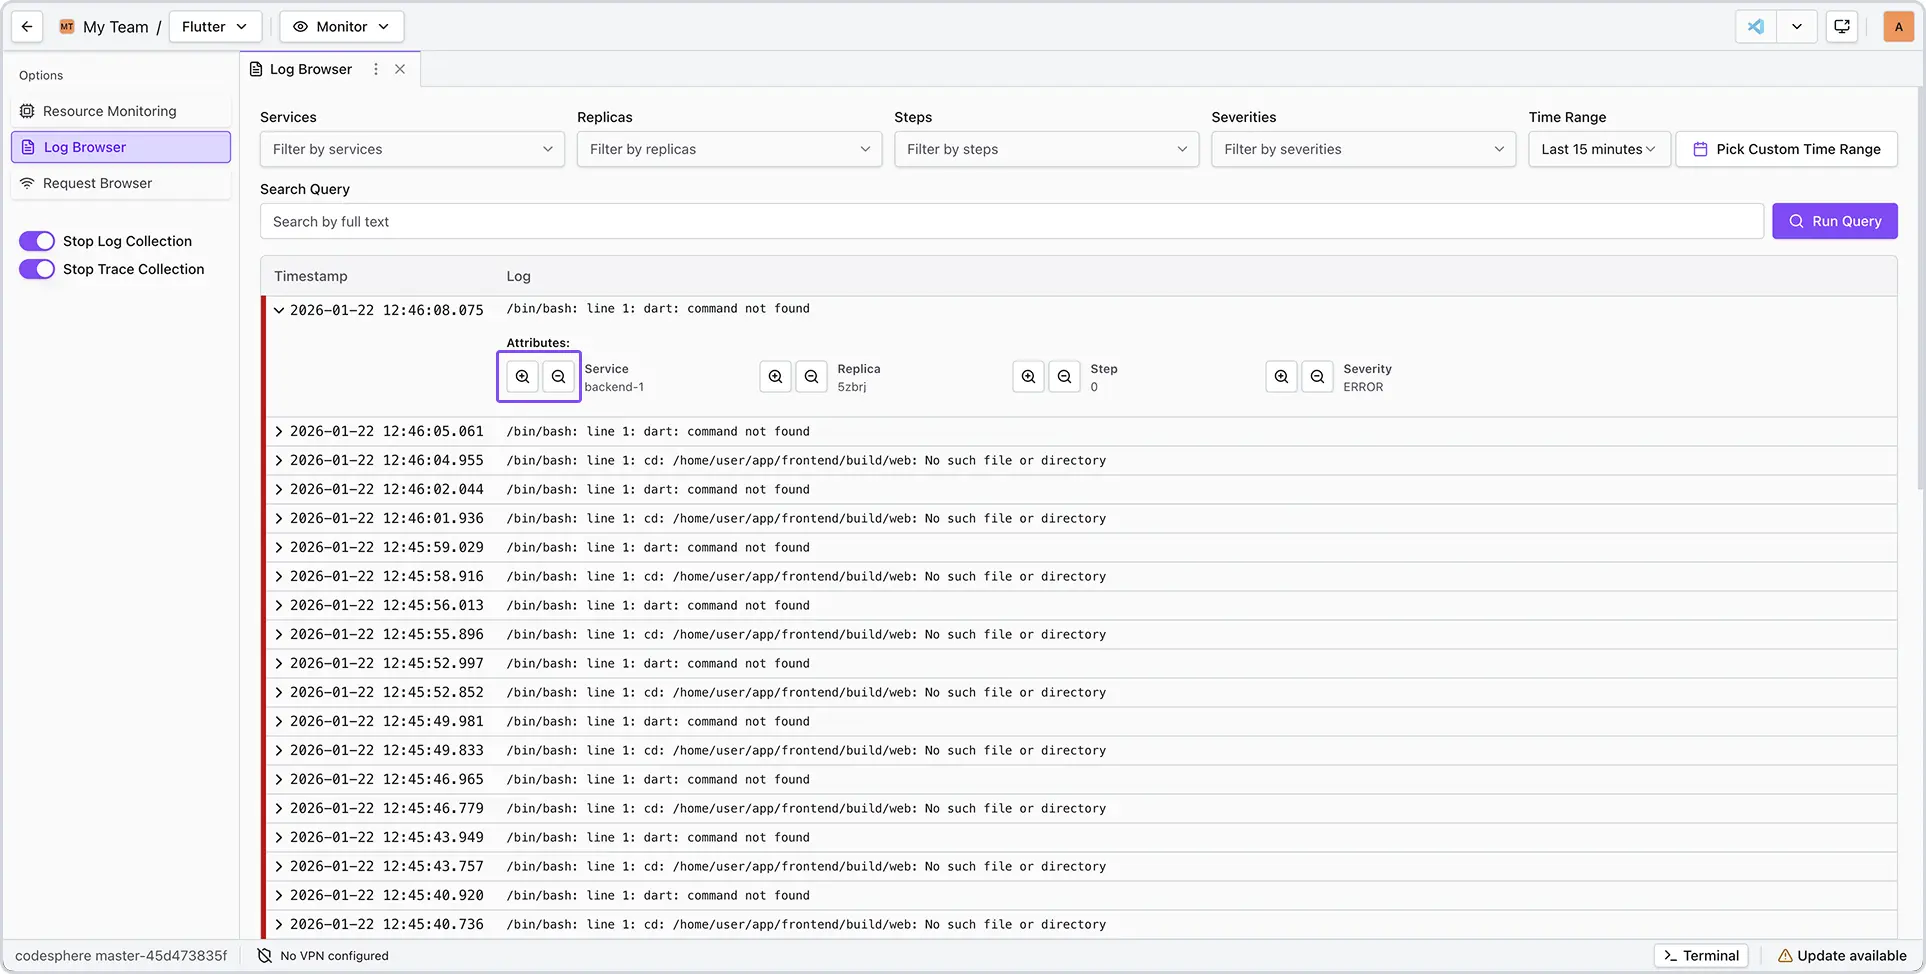
- Attribute Filter Buttons Expand a log entry and use the magnifying glass icons:
- Plus (+): Adds the attribute (e.g., Service name) to active filters.
- Minus (-): Excludes that attribute from your view.
-
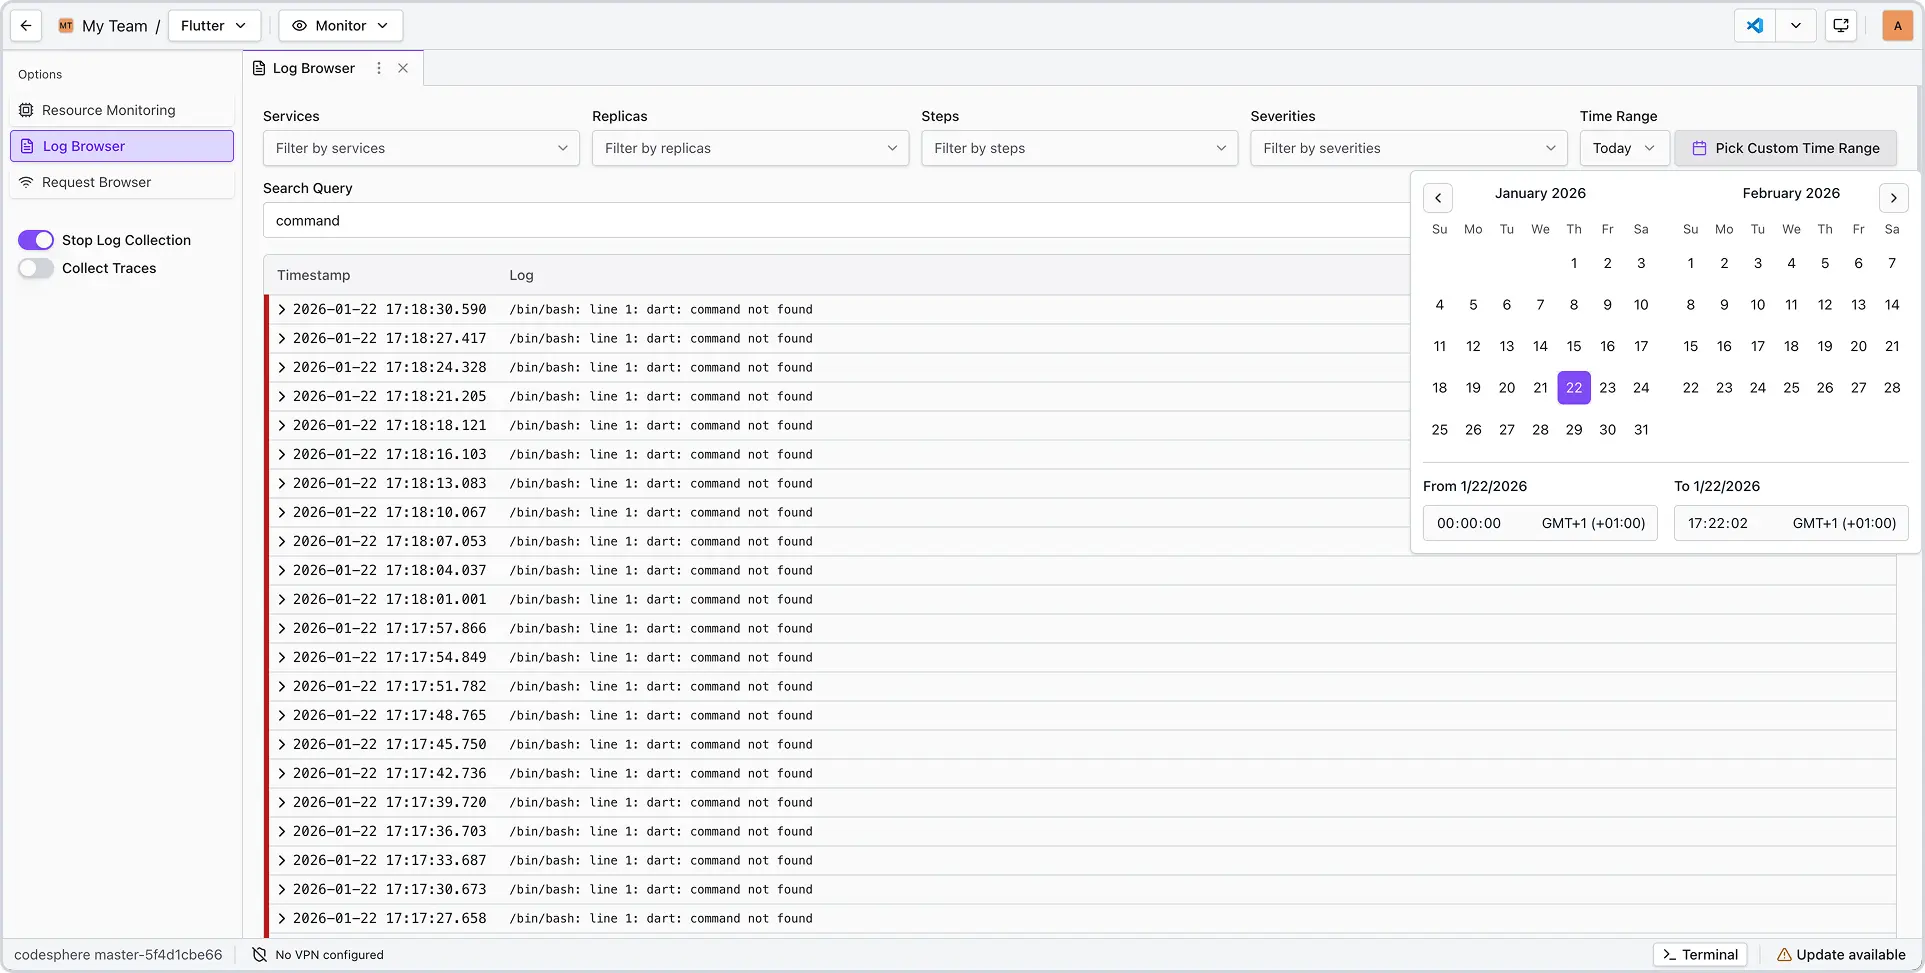
Time Filtering: Use the time selector to inspect specific historical periods.
-
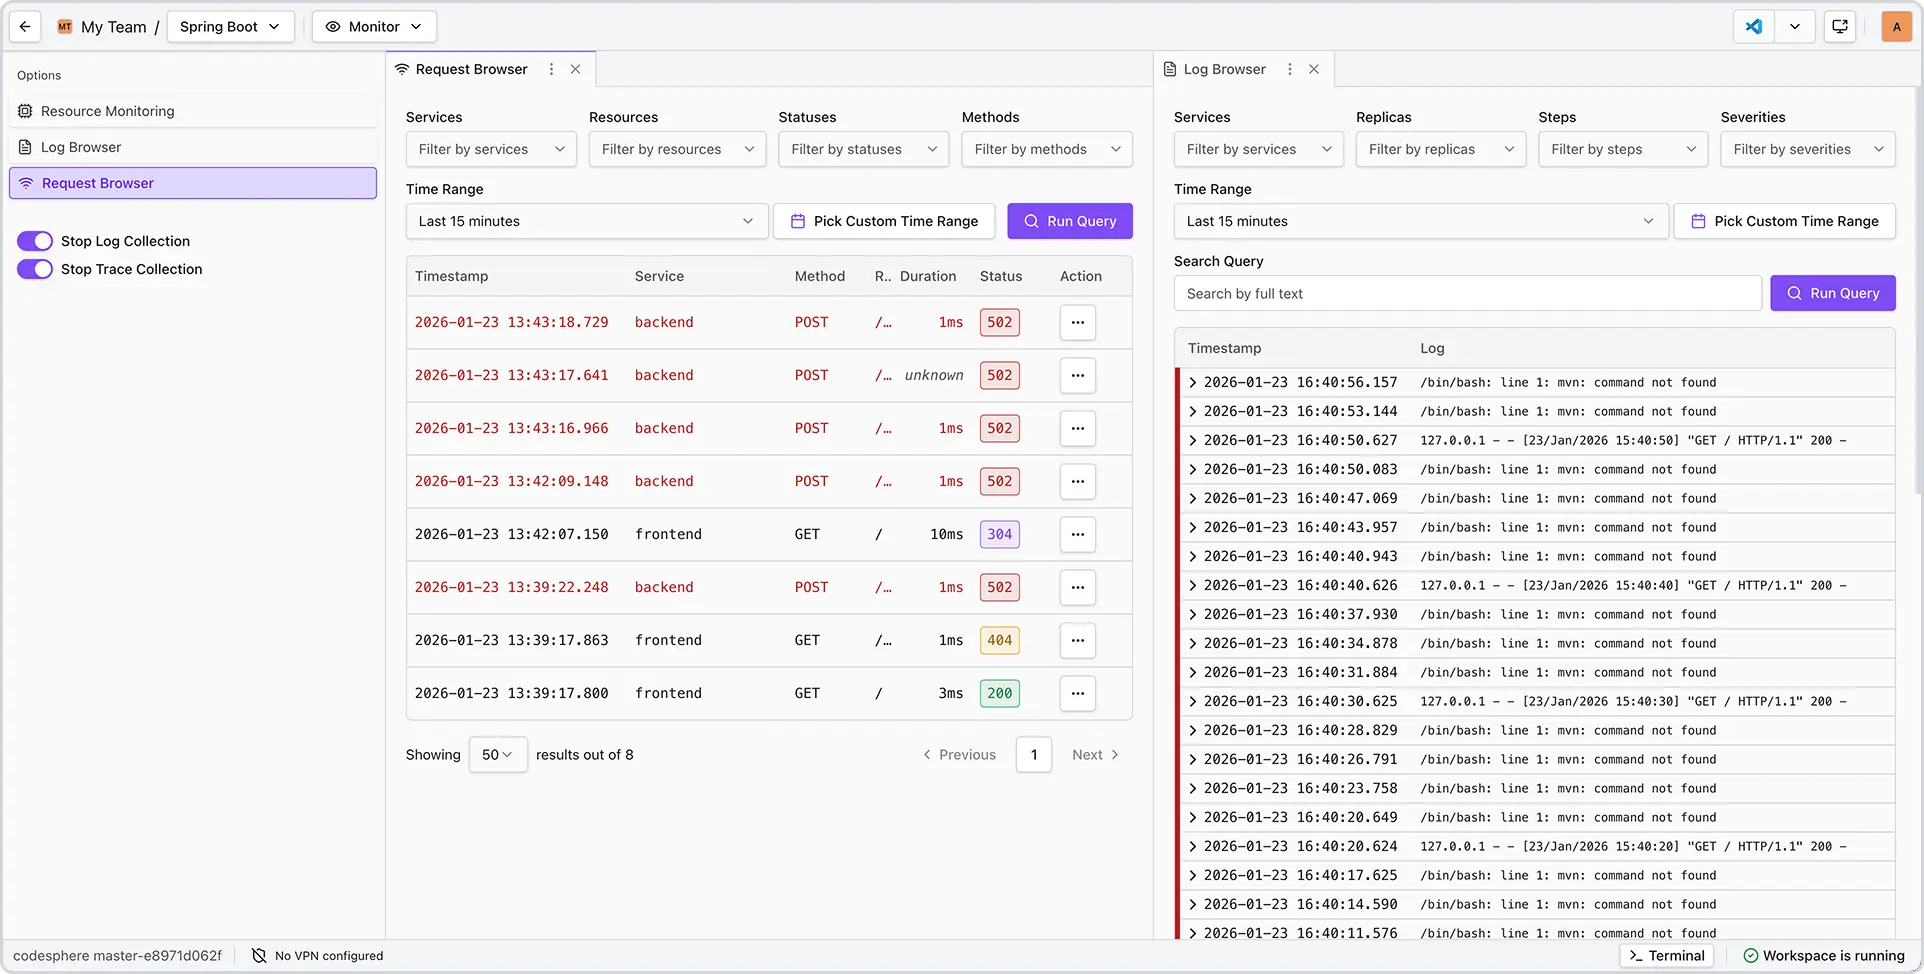
Split Screen: View the Log Browser and Request Browser side-by-side for deep debugging. (Note: Both log and trace collection must be active).
Troubleshooting & Common Errors
| Error/Message | Root Cause | Solution/Example |
|---|---|---|
| Logs are Empty | App not printing to stdout/stderr or incorrect run command. | Use console.log() (Node) or print() (Python). Check ci.yml. |
| No requests match | Filter criteria is too restrictive. | Adjust filters or time range. |
| Time Zone Confusion | Logs are timestamped in UTC. | Adjust local perception or use a viewer with TZ conversion. |
How Codesphere Collects Logs
Codesphere uses OpenTelemetry (OTel), a standard industry framework, to process data.
It follows a Unified Format: Metadata (Replica IDs, Service Names) is attached automatically.
Frequently Asked Questions
-
What is the retention period for logs?
Logs are retained for 14 days. Warning: Deactivating monitoring at the Team level deletes all logs immediately and permanently.
-
How are logs collected?
We utilize OpenTelemetry (OTel). It is a lightweight, industry-standard framework compatible with most modern application stacks.
-
Can logs be exported?
Currently, logs cannot be exported directly as a file (CSV/TXT). We recommend manual copying for long-term auditing.

Have a feature request? Help us shape the future of Codesphere. You can request new features or vote on the community roadmap at feedback.codesphere.com.
-
Why don’t I see any data in the table?
To ensure exact 1:1 matching between traces and logs, your application should utilize OpenTelemetry standards. If OpenTelemetry is not detected, the system will fallback to timestamp correlation. While usually accurate, timestamp matching may occasionally surface nearby logs rather than the exact line responsible for the request.
-
Why am I not able to turn on log collection?
You likely need Admin permissions for the Resource Group (Team). Contact your Admin to enable monitoring.